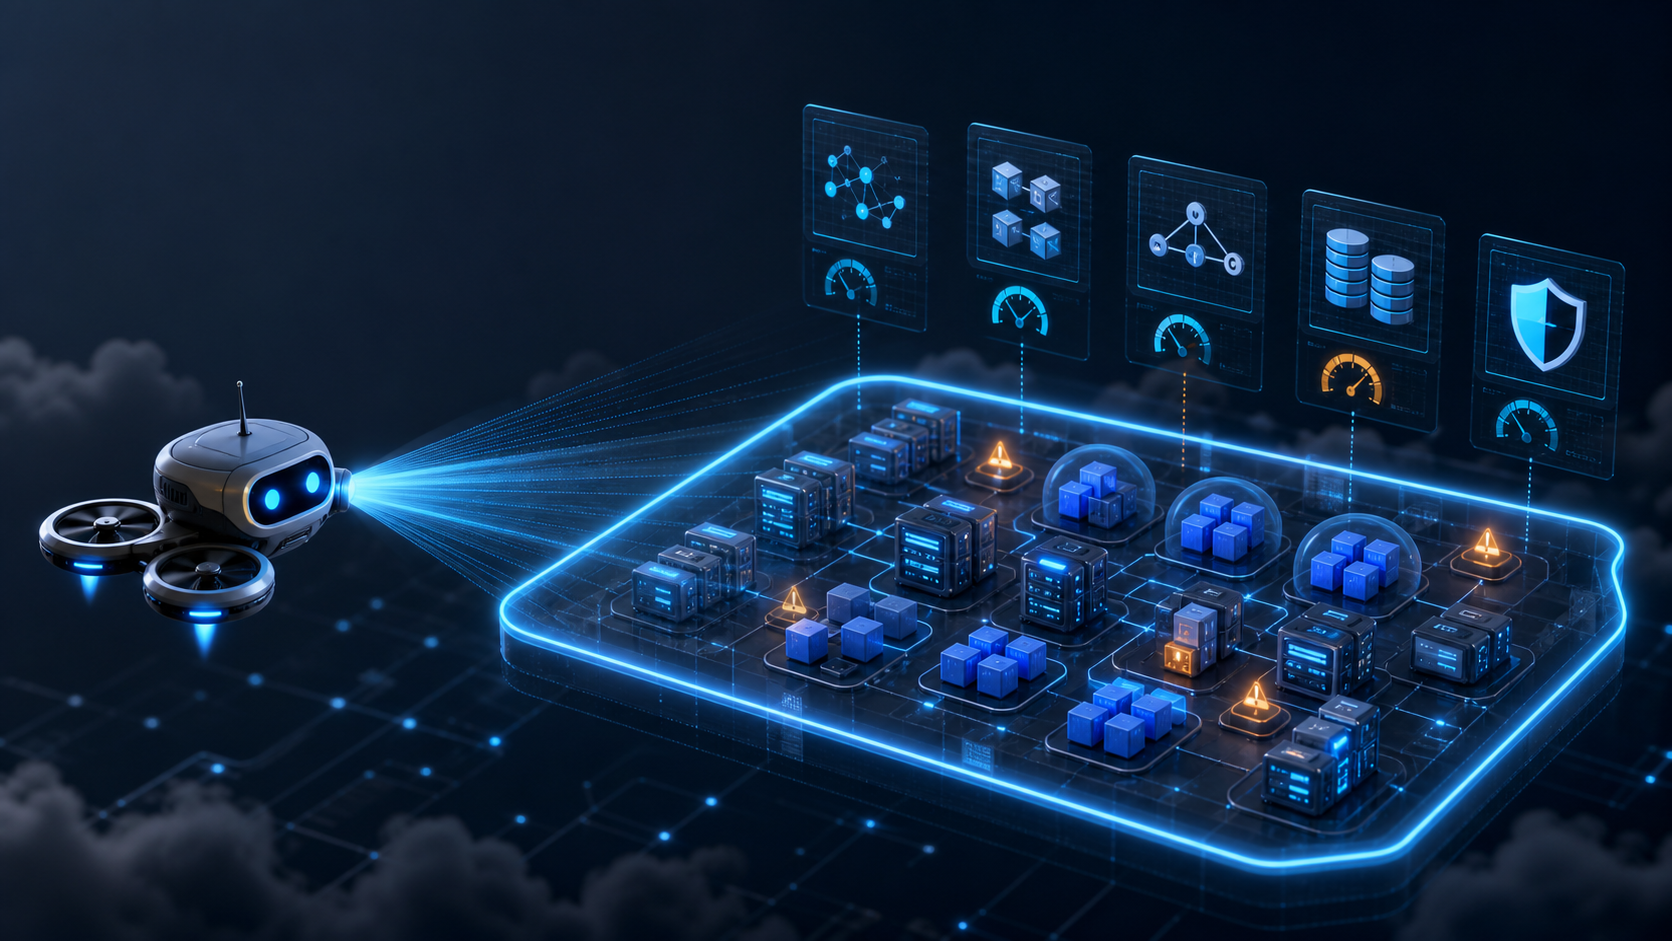
Kubernetes is very good at reporting desired state. A Deployment can be available while its pods restart every few hours. A cluster can show green nodes while workloads have no disruption budgets, probes, resource limits, or network isolation. Dashboards show signals; they do not necessarily connect them into an operational judgment.
That is the gap KubeBuddy tries to fill. The open-source KubeDeck project is a Go-based command-line scanner that connects through an existing Kubernetes context and evaluates cluster health, workloads, security, RBAC, networking, storage, and configuration. It can add provider-specific checks for AKS and GKE and emit terminal, HTML, JSON, and CSV output. There is no controller, Helm release, or long-running agent to install in the cluster.
This is a review of the KubeBuddy at kubebuddy.io and KubeDeckio/KubeBuddy. An unrelated dashboard project uses the same name at kubebuddy.org; do not mix their documentation or security assumptions.
How KubeBuddy fits into a platform
KubeBuddy is best understood as a snapshot scanner. It queries the API server, evaluates a catalog of more than 100 checks, and produces findings with severity, status, recommendations, and references. Optional integrations enrich that snapshot with Prometheus metrics or cloud-provider configuration. The official overview covers node and pod health, risky RBAC, networking, storage, and cloud best practices.
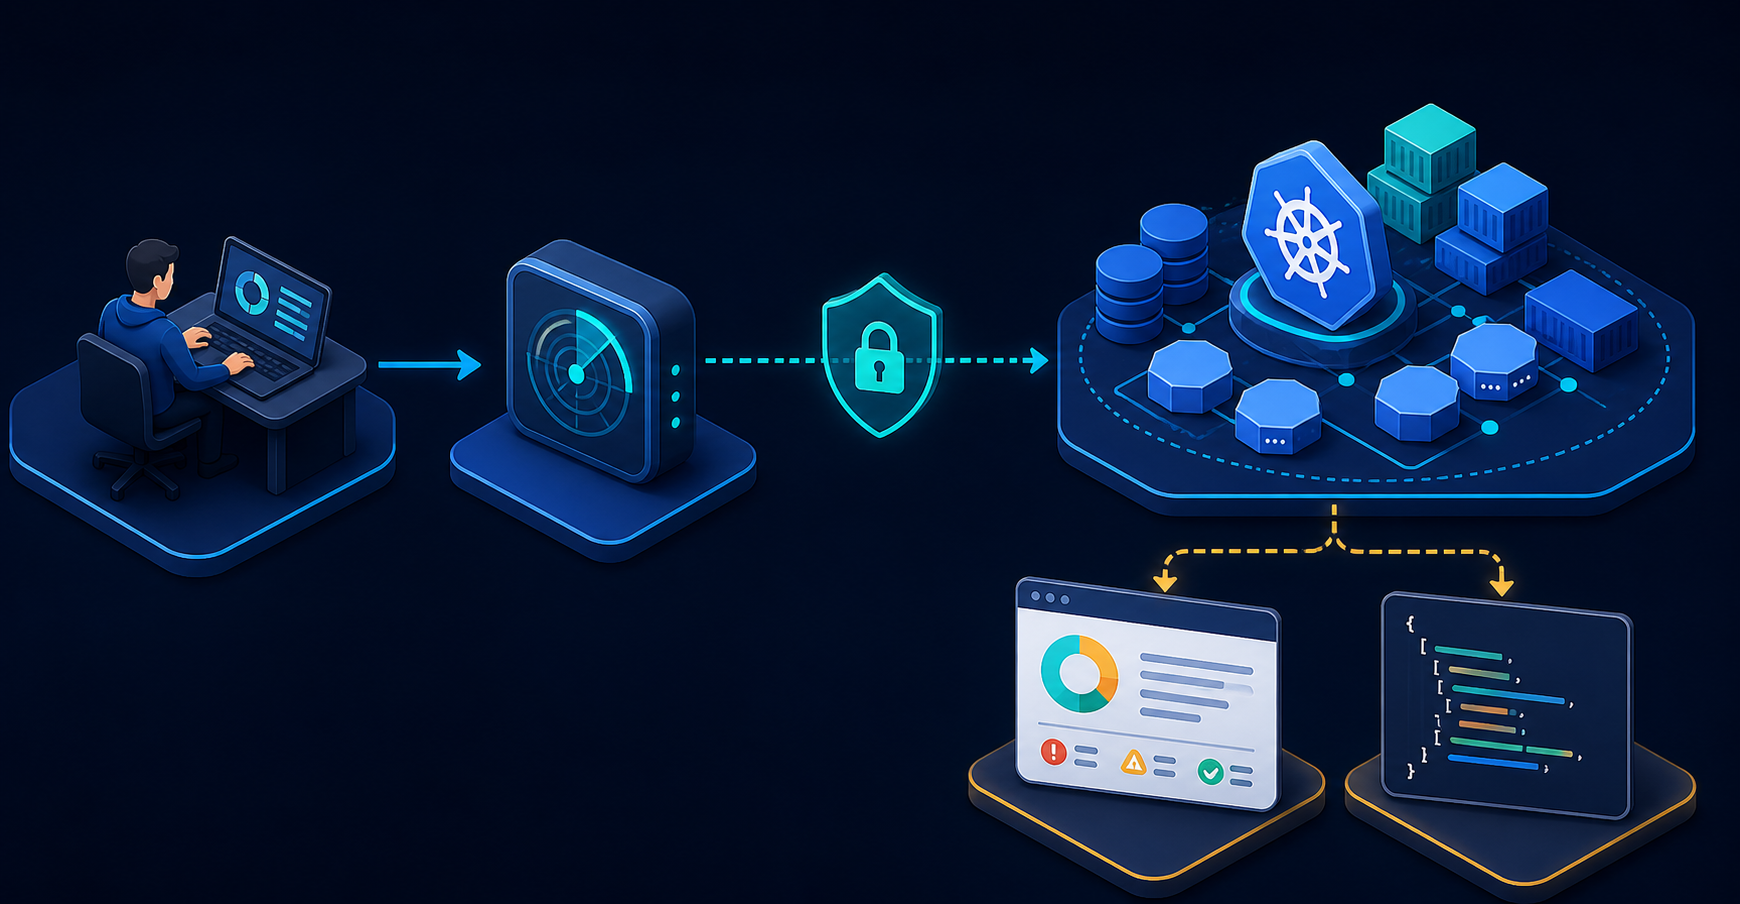
That architecture has real advantages. There is no in-cluster component to patch, no DaemonSet consuming resources, and no admission webhook in the deployment path. A platform team can run the same binary from a workstation, hardened jump host, container, or CI worker. HTML is useful for a human review; JSON or CSV can feed a pipeline, evidence store, or reporting system.
It also defines the boundary of the product. KubeBuddy does not replace Prometheus, alerting, runtime threat detection, policy admission, or a managed Kubernetes security service. A periodic snapshot can miss a short-lived failure. A finding identifies a condition; it does not prove exploitability, ownership, or business impact. Treat KubeBuddy as a second opinion and control validation layer, not as the source of truth for real-time health.
A five-minute first scan
The installation guide recommends Homebrew on macOS and Linux. Homebrew 6 requires explicit trust for non-official taps; installing the fully qualified formula limits trust to that formula:
brew install KubeDeckio/homebrew-kubebuddy/kubebuddy
kubebuddy version
Before scanning, make the target explicit. Accidentally assessing the wrong context is surprisingly easy:
kubectl config current-context
kubebuddy probe
kubebuddy summary
mkdir -p reports
kubebuddy run \
  --html-report \
  --json-report \
  --yes \
  --output-path ./reports
probe verifies access, summary provides a quick inventory, and run writes shareable reports. For direct terminal output, use kubebuddy scan --output text. These commands follow the project’s getting-started workflow.
Never publish a raw report blindly. Findings can expose namespace names, workload topology, image references, RBAC relationships, and configuration weaknesses. Store reports as security-sensitive build artifacts, apply retention controls, and redact before sharing outside the operations boundary.
The permission question matters
“Agentless” describes deployment, not privilege. KubeBuddy does not require cluster-admin, but the documented full scan needs broad cluster-wide reads across workloads, nodes, events, networking, storage, RBAC, CRDs, metrics, ConfigMaps, and Secrets. The project’s permissions reference includes a sample ClusterRole and access tests.
Validate the effective identity before a scan:
kubectl auth can-i list secrets --all-namespaces
kubectl auth can-i list clusterroles
kubectl auth can-i list customresourcedefinitions.apiextensions.k8s.io
kubectl auth can-i get nodes.metrics.k8s.io
From a security architecture perspective, broad read access is still powerful. Secret get or list access may reveal decoded credentials to a compromised scanner process, while RBAC and CRD visibility provides a detailed map of the platform. Use a dedicated identity, short-lived credentials, an isolated runner, pinned KubeBuddy versions, and restricted report storage. Review the supplied role rather than applying it unchanged: its wildcard read rule is convenient for broad CRD coverage but is wider than strict least privilege. Missing permissions should produce an understood coverage gap, not an automatic grant of cluster-admin.
Where it earns a place
1. Pre-change and post-change evidence
Run a scan before and after a Kubernetes upgrade, CNI change, ingress migration, or node-pool replacement. Comparing JSON output helps distinguish pre-existing debt from change-induced regression. This is particularly useful during a maintenance window when operators need a repeatable checklist, not another dashboard to interpret.
2. Cluster onboarding and inherited environments
When a platform team inherits a cluster, KubeBuddy provides a fast first pass across workloads, events, RBAC, storage, networking, and resilience settings. It will not replace discovery interviews or threat modelling, but it can turn an unfamiliar cluster into a prioritized investigation backlog.
3. CI and scheduled hygiene scans
The JSON report makes recurring scans practical. Run KubeBuddy from a network-restricted runner with a read-only service account, archive the output, and let a small policy step decide whether new critical findings should fail the job. Do not gate production on an unversioned latest image or on every warning: baselines, suppressions, and an exception process are essential to prevent alert fatigue.
4. AKS and GKE platform reviews
Generic Kubernetes checks cannot see every managed-service decision. KubeBuddy adds AKS and GKE coverage; AKS scans can receive subscription, resource-group, and cluster identifiers. The documented AKS form is:
kubebuddy run \
  --aks \
  --subscription-id "$AZURE_SUBSCRIPTION_ID" \
  --resource-group "$AKS_RESOURCE_GROUP" \
  --cluster-name "$AKS_CLUSTER_NAME" \
  --html-report \
  --yes \
  --output-path ./reports
Cloud API access creates a second authorization plane. Separate Kubernetes RBAC from Azure or Google Cloud IAM, scope both identities deliberately, and capture which checks were skipped when credentials are unavailable.
5. Security triage and risk-path discussion
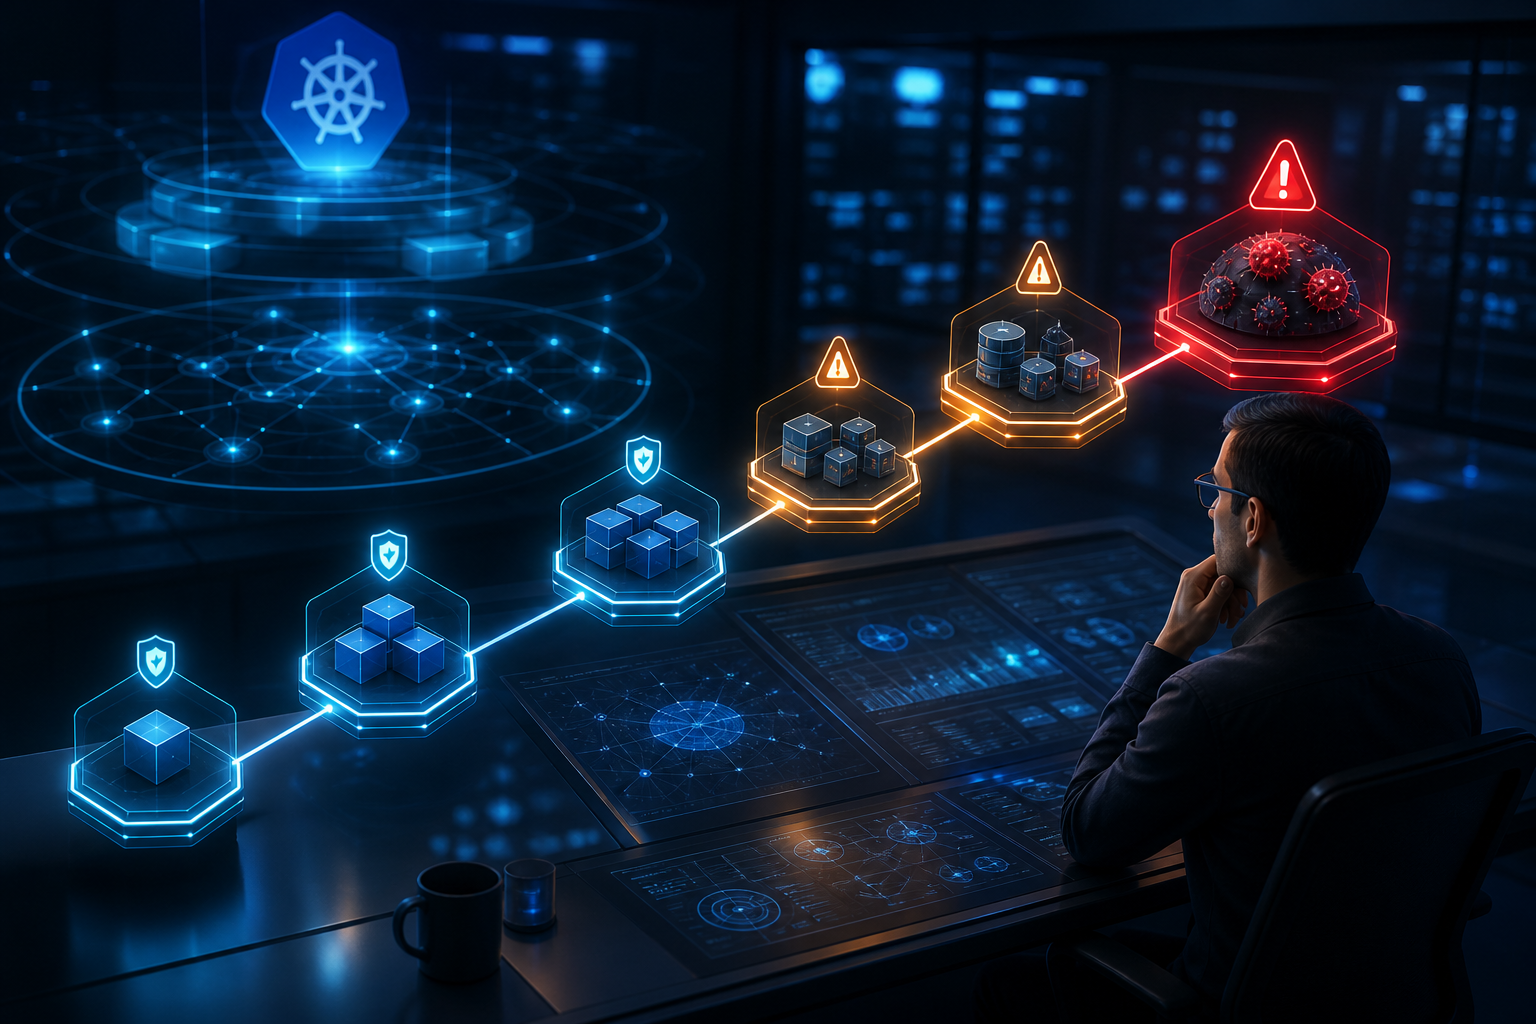
An isolated warning often looks harmless. Several connected weaknesses, an exposed service, permissive workload identity, sensitive Secret access, and broad RBAC, may form a credible attack path. KubeBuddy’s checks and risk documentation is useful for moving the conversation from a flat finding count to chains of conditions. The tool accelerates triage; a security engineer still validates reachability, compensating controls, and impact.
What I like—and what I would challenge
The strongest design choice is operational simplicity. A native binary, external execution, multiple report formats, and optional cloud or Prometheus enrichment make adoption easy. The Headlamp plugin offers another interface, while optional KubeBuddy Radar adds history and comparison. Keeping the CLI useful without Radar avoids making the hosted workflow mandatory.
The interfaces are not equivalent. The browser-side Headlamp plugin uses resources the current Headlamp session can read, but it does not run provider API, Prometheus, PowerShell, kubectl, or native Go engine checks. Radar is a separate authenticated control plane for saved profiles, private report history, trends, and comparisons; the scan still executes locally. That separation is sensible, but it means an architecture review must document where execution occurs, which data leaves the runner, and whether a paid Radar workflow is in scope. Compare results only when the runtime, check catalog, exclusions, and credentials are equivalent.
The main limitation is the nature of snapshot analysis. Resource configuration and current state provide evidence, but not complete causality. A restart may have happened outside the scan window; a permissive role may be intentionally constrained by identity governance; a missing NetworkPolicy may be offset by another enforcement layer. Teams must validate findings and tune exclusions rather than chase a perfect score.
I would also scrutinize release maturity and supply-chain controls before enterprise rollout. Pin a tested version, verify provenance and checksums where available, review the open-source changelog, and test new check catalogs against a non-production cluster. “100+ checks” is not the same as complete coverage of CIS benchmarks, Kubernetes policy, cloud posture, or runtime behavior. Map checks to your own controls and document what remains uncovered.
Adoption recommendation
Start with one non-production cluster and one named owner. Run the scan manually, classify findings as actionable, accepted, false positive, or needs context, and record scan duration plus permission gaps. Then repeat after remediation. If the signal is useful, put the exact version and configuration in source control and schedule scans from a dedicated runner.
For a fleet, define a minimum profile per cluster type, centralize reports securely, and measure new or regressed findings rather than total findings alone. Use HTML for operational review and JSON/CSV for automation. Keep monitoring, admission control, vulnerability scanning, and runtime detection in place.
My conclusion: KubeBuddy is a useful, low-friction diagnostic lens for platform teams, especially for inherited clusters, change validation, managed Kubernetes reviews, and periodic hygiene. Its agentless model lowers the cost of trying it, but its broad read access and snapshot nature deserve explicit controls. Used as a repeatable second opinion, it can expose the uncomfortable space between “Kubernetes says healthy” and “the platform is operated safely.”