If you install k3s with the default settings it also installs Traefik as a load balancer. Traefik also offers a dashboard which is very easy to enable. If you go on your k3s machines to the path /var/lib/rancher/k3s/server/manifests you can find their traefik.yaml. To enable the Traefik dashboard you have to add dashboard.enabled: “true” to the yaml.
root@k3s-master-1:/var/lib/rancher/k3s/server/manifests# cat traefik.yaml
apiVersion: helm.cattle.io/v1
kind: HelmChart
metadata:
  name: traefik
  namespace: kube-system
spec:
  chart: https://%{KUBERNETES_API}%/static/charts/traefik-1.77.1.tgz
  set:
    rbac.enabled: "true"
    ssl.enabled: "true"
    metrics.prometheus.enabled: "true"
    kubernetes.ingressEndpoint.useDefaultPublishedService: "true"
    dashboard.enabled: "true"
root@k3s-master-1:/var/lib/rancher/k3s/server/manifests# cat traefik.yaml
apiVersion: helm.cattle.io/v1
kind: HelmChart
metadata:
  name: traefik
  namespace: kube-system
spec:
  chart: https://%{KUBERNETES_API}%/static/charts/traefik-1.77.1.tgz
  set:
    rbac.enabled: "true"
    ssl.enabled: "true"
    metrics.prometheus.enabled: "true"
    kubernetes.ingressEndpoint.useDefaultPublishedService: "true"
    dashboard.enabled: "true"
After a few minutes you will see some extra pods getting started.
root@k3s-master-1:~# kubectl get pods -n kube-system
NAME                              READY   STATUS      RESTARTS   AGE
helm-install-traefik-4lz62        0/1     Completed   0          14d
coredns-66f496764-46dpj           1/1     Running     0          14d
svclb-traefik-kc6sx               3/3     Running     0          14d
svclb-traefik-tmwv6               3/3     Running     6          14d
svclb-traefik-24dm6               3/3     Running     3          14d
svclb-traefik-xxbcd               3/3     Running     3          14d
svclb-traefik-8n5cq               3/3     Running     3          14d
svclb-traefik-xqf2g               3/3     Running     3          14d
helm-install-traefik-btn4j        0/1     Completed   0          14d
helm-install-traefik-cv7mj        0/1     Completed   0          12d
traefik-7f759dfc78-4ds69          1/1     Running     0          12d
metrics-server-5f476d6468-99f2s   1/1     Running     1          12d
svclb-traefik-82wj2               3/3     Running     6          14d
Also a new endpoint is added for the Traefik Dahsboard.
root@k3s-master-1:~# kubectl get endpoints -n kube-system
NAME                ENDPOINTS                                   AGE
kube-dns            10.42.0.9:53,10.42.0.9:53,10.42.0.9:9153    14d
traefik-dashboard   10.42.5.7:8080                              12d
traefik             10.42.5.7:80,10.42.5.7:8080,10.42.5.7:443   14d
metrics-server      10.42.3.7:443                               12d
You can the browse to the dashboard on port 8080.
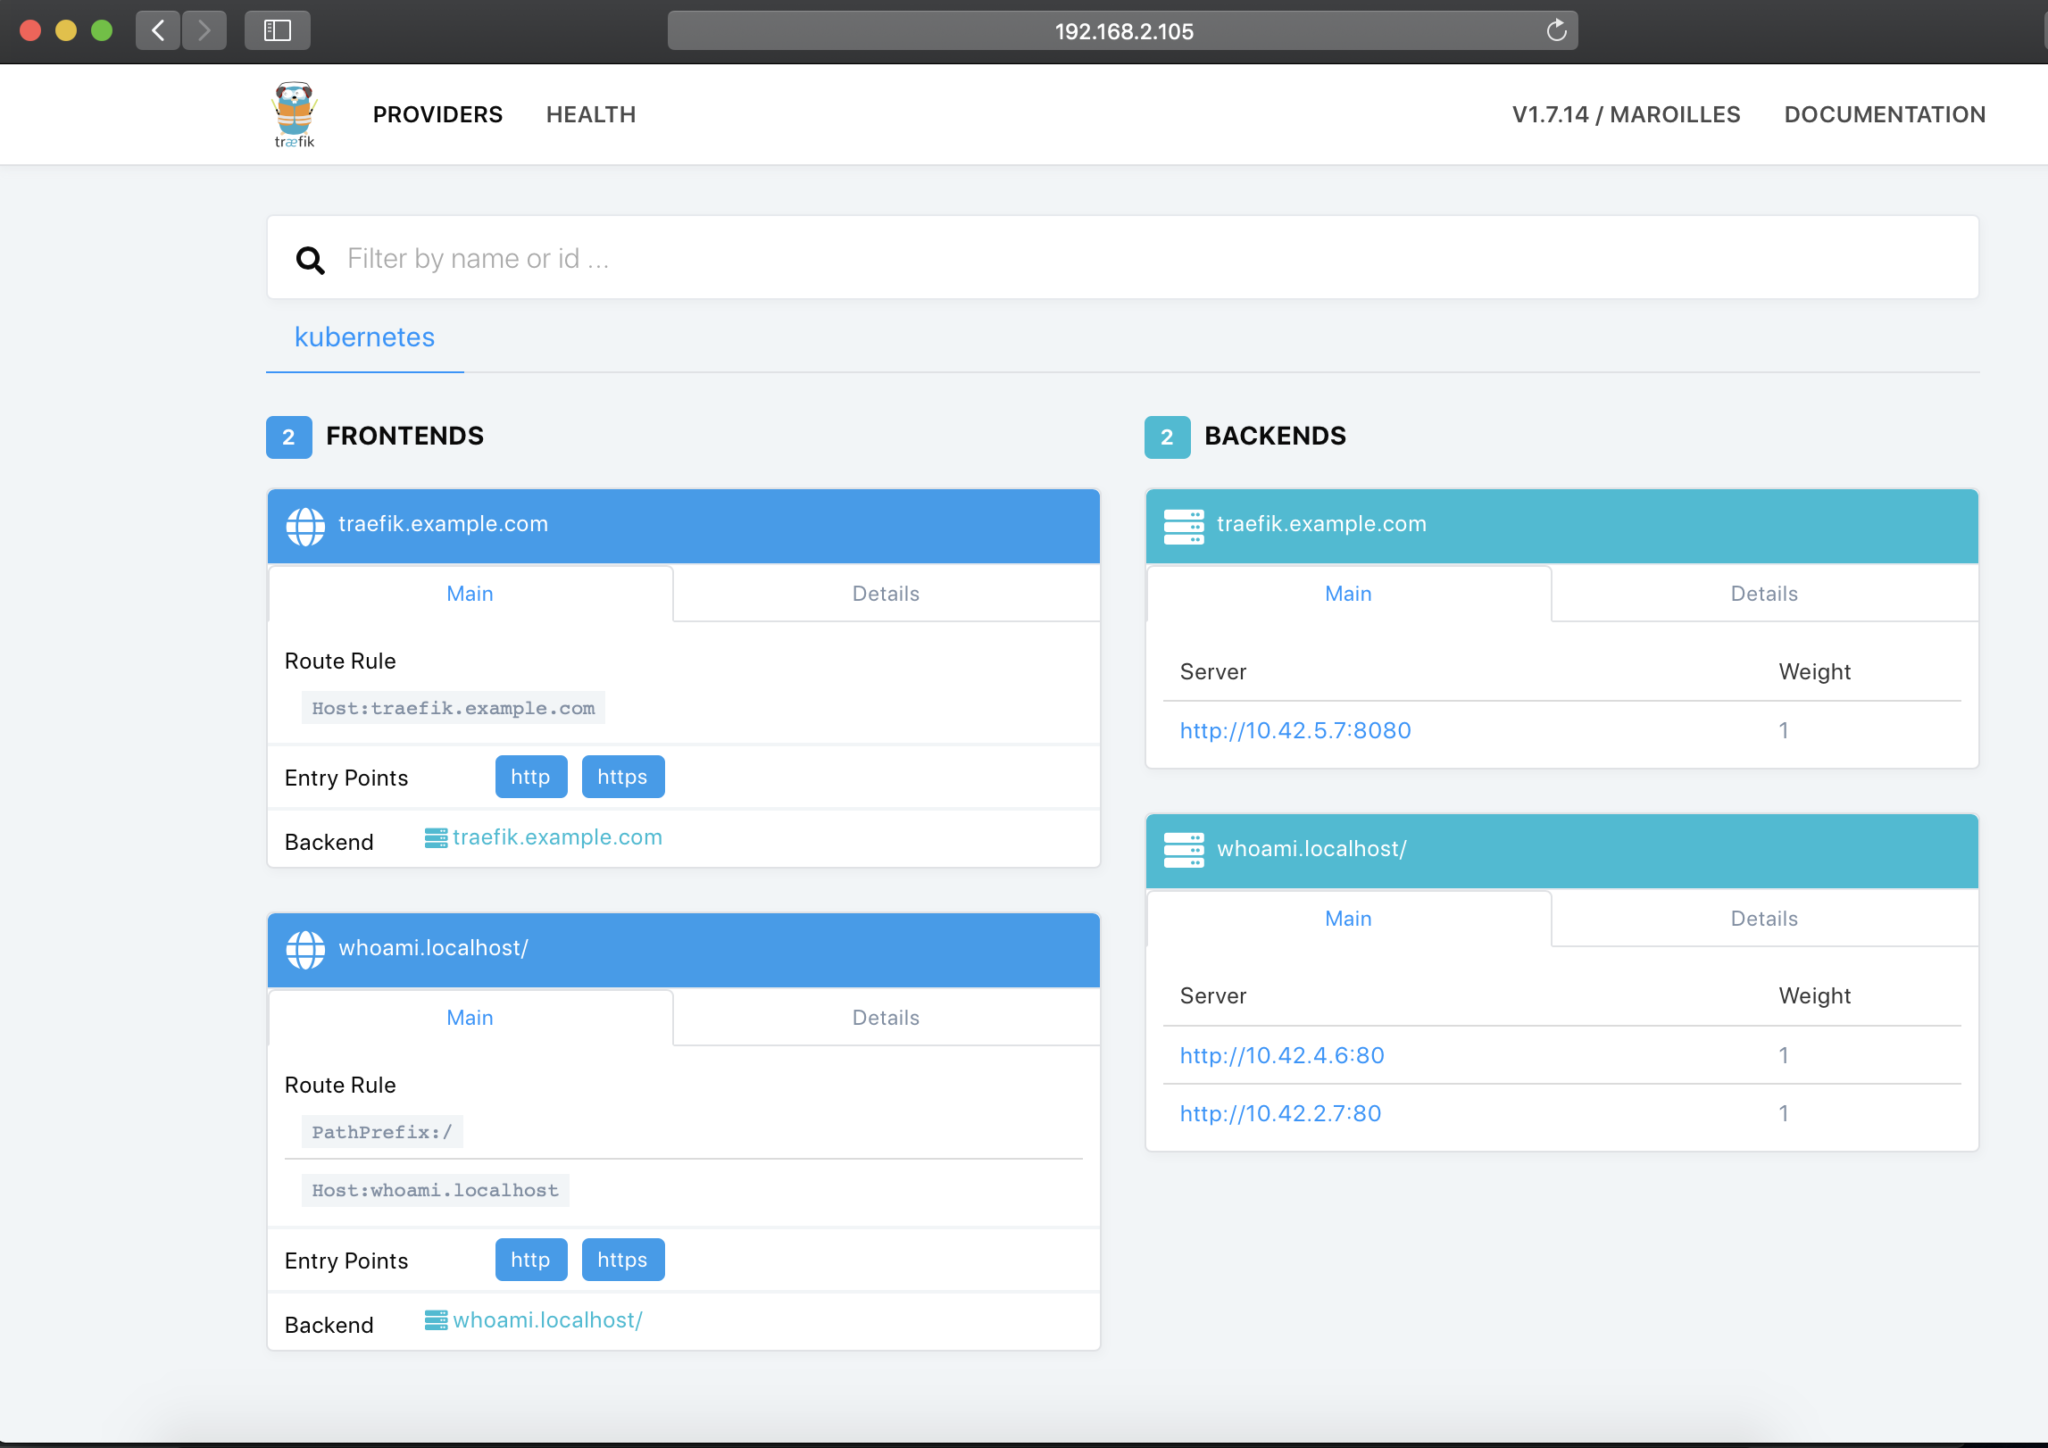
For more information about how to use Traefik and the Traefik dashboard you can go to Containous.