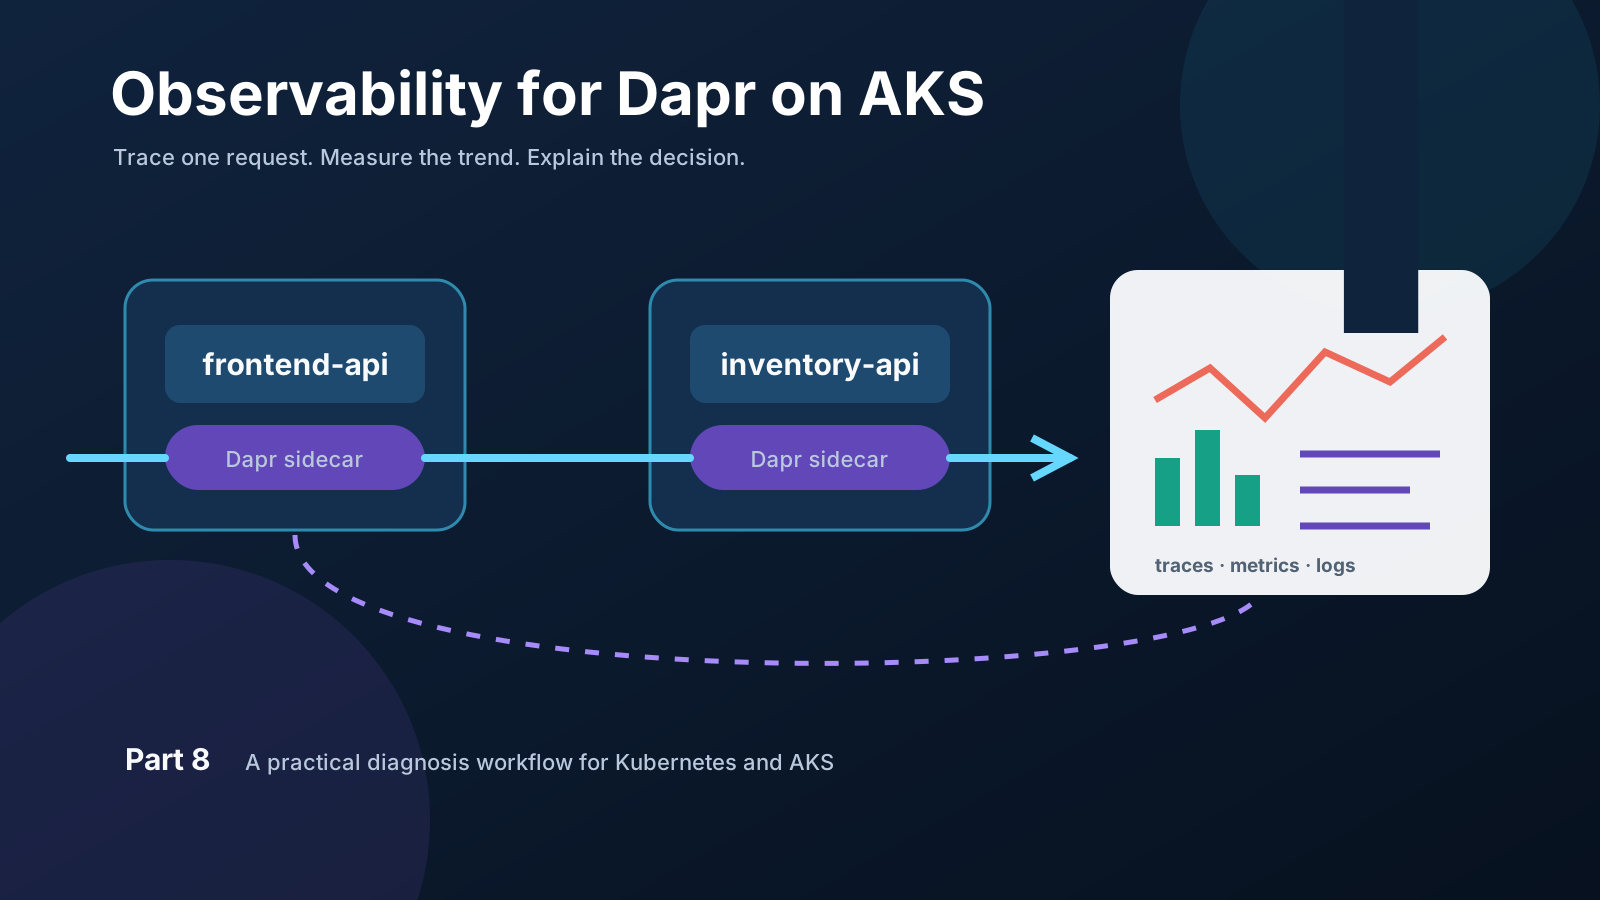
A request can fail even when every Kubernetes pod is Running. The application may be waiting for a Dapr component, a retry may mask a slow dependency, or a call may reach the wrong app ID. Pod health tells us that the processes are alive; it does not explain the path a request takes.
Dapr exposes three complementary signals. A trace reconstructs a single request across service boundaries. Metrics show whether a symptom is becoming a trend. Logs explain what a particular application or sidecar decided at a particular moment. The useful operational view comes from connecting all three.
Outcome: Deploy two Dapr-enabled services and Zipkin, trace a checkout request across both sidecars, inspect Prometheus metrics, correlate structured application and sidecar logs by trace ID, and translate the local lab into an AKS monitoring design.
This is Part 8 of the Dapr on Kubernetes and AKS series. It follows Bindings, Secrets, and Actors with Dapr on AKS. The lab runs on any Kubernetes cluster with Dapr installed; the production section focuses on AKS.
Read the three signals together
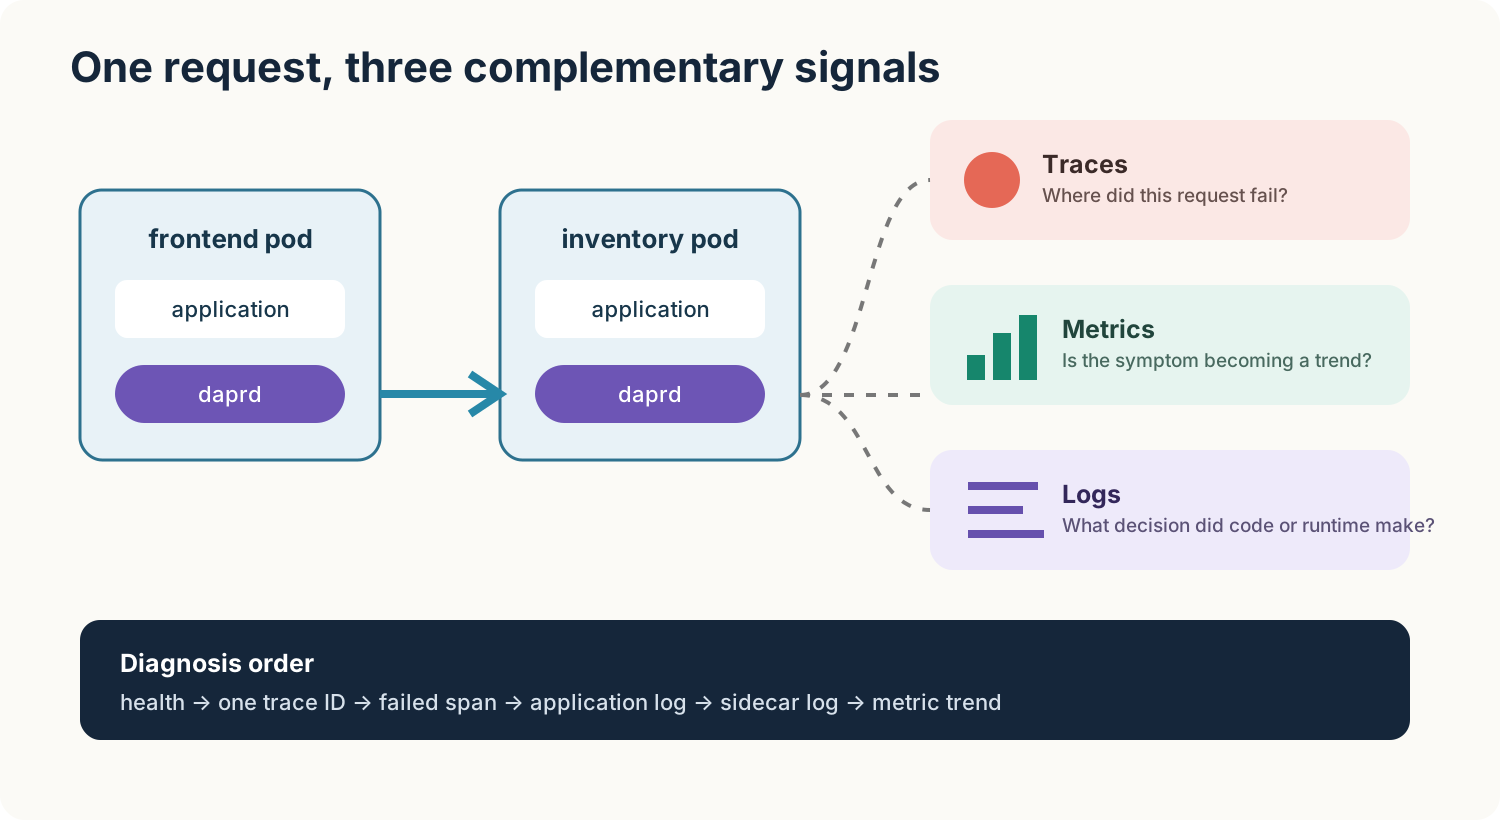
Each signal answers a different question:
| Signal | Best question | Typical Dapr source |
|---|---|---|
| Traces | Where did this request spend time or fail? | Service invocation, pub/sub, bindings, and application spans |
| Metrics | Is this an isolated request or a growing pattern? | Sidecars and Dapr control-plane services |
| Logs | What did the application or runtime decide? | Application container, daprd, operator, injector, placement, scheduler |
Start with the symptom, use a trace to narrow the failing hop, use metrics to establish scope, and then inspect the relevant logs. Searching every container log first usually creates more noise than evidence.
Prerequisites
You need:
- a Kubernetes cluster with
kubectlconnected; - Dapr installed and healthy;
- the Dapr CLI for the convenient inspection commands;
curl; and- optionally
jqfor readable JSON logs.
Confirm the control plane before creating the sample:
dapr status --kubernetes

kubectl get pods \
  --namespace dapr-system
All required Dapr services should report healthy or Running. If your managed Dapr installation uses a different namespace, use that namespace in the Kubernetes commands.
Step 1: Download and apply the complete lab
Download the complete observability manifest, save it as observability.yaml, and apply it:
kubectl apply \
  --filename observability.yaml

kubectl rollout status \
  deployment/zipkin \
  --namespace dapr-observability

kubectl rollout status \
  deployment/inventory-api \
  --namespace dapr-observability

kubectl rollout status \
  deployment/frontend-api \
  --namespace dapr-observability
The manifest creates:
frontend-api, which receives a checkout and invokesinventory-apithrough Dapr;inventory-api, which accepts or deliberately rejects a reservation;- a Dapr
Configurationthat enables tracing, metrics, error-code metrics, and API logs; and - a small Zipkin deployment that stores this lab’s traces in memory.
Verify that Dapr injected a daprd container beside both applications:
kubectl get pods \
  --namespace dapr-observability \
  --selector 'app in (frontend-api,inventory-api)' \
  --output jsonpath='{range .items[*]}{.metadata.name}{"  "}{.spec.containers[*].name}{"\n"}{end}'
Expected shape:
frontend-api-...   frontend-api daprd
inventory-api-...  inventory-api daprd
If daprd is absent, inspect the pod annotations and injector logs before continuing.
Step 2: Understand the observability configuration
The central part of the manifest is this namespaced Dapr Configuration:
apiVersion: dapr.io/v1alpha1
kind: Configuration
metadata:
  name: observability
  namespace: dapr-observability
spec:
  tracing:
    samplingRate: "1"
    zipkin:
      endpointAddress: http://zipkin.dapr-observability.svc.cluster.local:9411/api/v2/spans
  metrics:
    enabled: true
    recordErrorCodes: true
  logging:
    apiLogging:
      enabled: true
      obfuscateURLs: true
      omitHealthChecks: true
The pod annotation dapr.io/config: observability selects it. Configuration changes are read when the sidecar starts, so restart the application deployments after changing this resource.
samplingRate: "1" records every trace and makes the lab predictable. It is normally too expensive for a busy production service. Dapr accepts a value from 0 to 1; choose a lower production rate from traffic volume, diagnostic needs, and backend cost. Dapr’s default is deliberately very low, so explicitly configure it instead of assuming that every request will appear.
Zipkin and OpenTelemetry are alternative exporters in this block; configure one, not both. In production, OpenTelemetry Protocol (OTLP) to an OpenTelemetry Collector is usually the more flexible route because the collector can enrich, sample, and export telemetry to a backend such as Application Insights.
API logging is intentionally enabled for the exercise. It is off by default and can be verbose. obfuscateURLs and omitHealthChecks reduce accidental data exposure and noise, but payloads, baggage, URLs, and headers still need a deliberate data-classification policy.
Step 3: Send a successful request
Forward local port 3500 to the Dapr sidecar in the frontend pod:
kubectl port-forward \
  deployment/frontend-api \
  3500:3500 \
  --namespace dapr-observability
Keep that terminal open. In a second terminal, invoke the frontend through Dapr:
curl --fail-with-body --show-error \
  --request POST \
  --header 'Content-Type: application/json' \
  --data '{"orderId":"order-1001","sku":"coffee-001","quantity":1}' \
  http://localhost:3500/v1.0/invoke/frontend-api/method/checkout
Expected response:
{"accepted": true, "inventoryStatus": 200, "traceId": "..."}
The exact trace ID changes on every request. The call has crossed four observable runtime boundaries: the frontend sidecar, the frontend application, the inventory sidecar, and the inventory application.
The sample explicitly forwards the incoming W3C traceparent and tracestate headers when it calls its local sidecar. Dapr propagates trace context to an application, but application code must preserve that context when it starts the next sequential Dapr call. OpenTelemetry instrumentation normally handles this; the small standard-library sample does it visibly.
Step 4: Follow the request in Zipkin
In another terminal, expose Zipkin locally:
kubectl port-forward \
  service/zipkin \
  9411:9411 \
  --namespace dapr-observability
Open http://localhost:9411/zipkin, click Run query, and open the newest trace. You should see the service invocation path involving frontend-api and inventory-api.
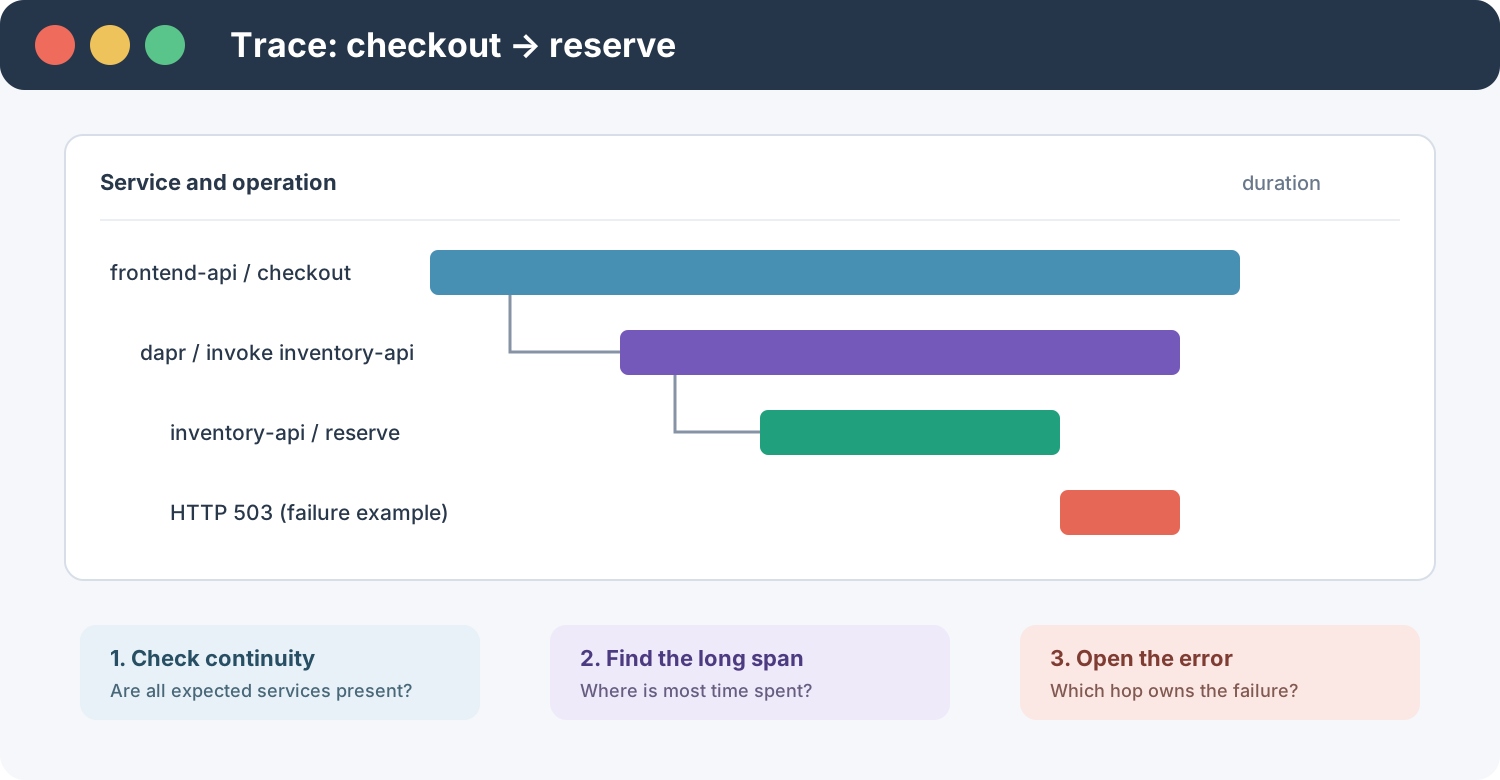
Use the waterfall to answer three questions:
- Is the expected service present?
- Which span owns most of the latency?
- Is the trace continuous, or did context disappear at an application boundary?
Zipkin is intentionally local and ephemeral here. A production trace backend needs durable storage, retention, access control, capacity planning, and a sampling policy.
Step 5: Create a failure you can diagnose
The inventory sample returns HTTP 503 for the special SKU FAIL-DEMO. Send it without --fail so curl prints the response body:
curl --include --show-error \
  --request POST \
  --header 'Content-Type: application/json' \
  --data '{"orderId":"order-1002","sku":"FAIL-DEMO","quantity":1}' \
  http://localhost:3500/v1.0/invoke/frontend-api/method/checkout
The frontend converts the failed downstream reservation to HTTP 502. The response also contains the trace ID. Refresh Zipkin and compare this trace with the successful one. This is much more useful than knowing only that the public request returned 502: the trace identifies the failing hop.
Step 6: Correlate application and sidecar logs
Both applications write one JSON object per decision and include the W3C trace ID. Read the application logs:
kubectl logs \
  deployment/frontend-api \
  --container frontend-api \
  --namespace dapr-observability \
  --since 10m

kubectl logs \
  deployment/inventory-api \
  --container inventory-api \
  --namespace dapr-observability \
  --since 10m
The failed request produces records shaped like:
{"app":"inventory-api","event":"inventory.rejected","sku":"FAIL-DEMO","traceId":"..."}
{"app":"frontend-api","event":"checkout.failed","inventoryStatus":503,"traceId":"..."}
Search the sidecar logs for the same time window:
kubectl logs \
  deployment/frontend-api \
  --container daprd \
  --namespace dapr-observability \
  --since 10m

kubectl logs \
  deployment/inventory-api \
  --container daprd \
  --namespace dapr-observability \
  --since 10m
The annotation dapr.io/log-as-json: "true" makes sidecar logs easier for Azure Monitor or another log backend to parse. Keep application logs structured too, use stable field names such as app, event, traceId, and orderId, and never put secrets or sensitive W3C baggage into them.
Sidecar and application logs are different evidence. An application log explains the business decision; a daprd log explains invocation, component, policy, or runtime behaviour. Preserve both container names when collecting them.
Step 7: Inspect the Prometheus endpoint
Dapr sidecars expose Prometheus-compatible metrics on port 9090 by default. Stop the earlier frontend port-forward or use a fourth terminal, then forward that port:
kubectl port-forward \
  deployment/frontend-api \
  9090:9090 \
  --namespace dapr-observability
Inspect the endpoint:
curl --silent --show-error \
  http://localhost:9090/ \
  | grep --extended-regexp '^dapr_(http|grpc|component|error_code)' \
  | head -n 30
Metric names vary between runtime versions, so discover what your installed Dapr version exposes instead of hard-coding a dashboard from another release. The recordErrorCodes: true setting adds error-code counters that make runtime failures easier to group.
A single scrape is a snapshot. Prometheus turns these samples into rates, percentiles, and trends. Useful operational questions include:
- Is the invocation error rate increasing for one app ID?
- Did latency change after a rollout?
- Are component failures isolated to one sidecar or cluster-wide?
- Is telemetry cardinality growing because a label contains unbounded values?
Do not add order IDs, user IDs, URLs with identifiers, or other high-cardinality values to metric labels. Put request-specific identifiers in traces and logs.
What happened to the Dapr Dashboard?
Older walkthroughs use dapr dashboard -k. That is no longer a sound new operational dependency: the current Dapr 1.18 release line does not publish a supported Dashboard release, and the command was removed from current CLI guidance.
Use supported, purpose-specific views instead:
dapr status --kubernetes
dapr components --kubernetes --namespace dapr-observability
dapr configurations --kubernetes --namespace dapr-observability

kubectl get pods,components.dapr.io,configurations.dapr.io \
  --namespace dapr-observability
Use Zipkin or another trace backend for request paths, Prometheus and Grafana for time series, and your log backend for searchable events. This is less like one attractive screen, but it gives each operational question a maintained source of truth.
Dashboard options for development and operations
The retirement of the upstream Dashboard does not mean that graphical Dapr tools have disappeared. Diagrid offers two tools for different environments, and neither replaces the telemetry backends used in this lab.
The open-source Diagrid Dapr Dev Dashboard is a companion for local development. It discovers applications started with dapr run, Docker Compose, .NET Aspire, or Dapr Testcontainers and can display sidecars, components, subscriptions, actors, workflows, state records, resiliency policies, and live application or sidecar logs. Its builders can also help author component and resiliency YAML.
The Dev Dashboard is not designed to connect to an AKS cluster or run inside Kubernetes. It has no production authentication, authorization, or multi-user model, so keep it on a developer machine and do not expose it publicly.
For Kubernetes and AKS, Diagrid Conductor is a managed option. An agent in the cluster connects outbound to Diagrid Cloud and provides Dapr control-plane health, component status, sidecar metrics and logs, application dependency visualization, alerts, recommendations, and—depending on the plan—operational features such as upgrades and certificate rotation. Review its network, identity, telemetry, and data-governance requirements before connecting a cluster.
The roles are therefore different:
| Tool | Appropriate use |
|---|---|
| Diagrid Dapr Dev Dashboard | Local, self-hosted Dapr development |
| Diagrid Conductor | Managed Dapr operations for Kubernetes and AKS |
| Zipkin, OpenTelemetry, Prometheus, Grafana, and Azure Monitor | Distributed traces, historical metrics, application logs, queries, and alerting |
Continue to use an observability backend for durable telemetry. The Dev Dashboard is a local inspection tool, while Conductor focuses on Dapr operational data and does not replace application-level tracing or application logs.
Move the pattern to AKS
The local lab proves the signals. A production AKS design needs collectors and durable backends.
Metrics: Azure Monitor managed service for Prometheus
For an existing AKS cluster, enable managed Prometheus with:
az aks update \
  --resource-group "$AKS_RESOURCE_GROUP" \
  --name "$AKS_CLUSTER_NAME" \
  --enable-azure-monitor-metrics
AKS Automatic includes more monitoring defaults; verify the current cluster configuration instead of running the update blindly. On AKS Standard, connect the cluster to the intended Azure Monitor workspace and Azure Managed Grafana instance. Then verify which Dapr endpoints are actually scraped. Depending on the monitoring configuration, use pod annotations, a PodMonitor, or scrape configuration for sidecar port 9090 and the Dapr control-plane services.
The Dapr project publishes Grafana dashboard templates for system services, sidecars, and actors. Import templates that match your Dapr runtime and validate every query against the metric names your cluster exposes.
Logs: Container Insights
Collect stdout/stderr from the application and daprd containers with Container Insights. On clusters using the current ContainerLogV2 table, a starting KQL query is:
ContainerLogV2
| where PodNamespace == "dapr-observability"
| where ContainerName in ("frontend-api", "inventory-api", "daprd")
| extend Entry = parse_json(LogMessage)
| extend TraceId = tostring(Entry.traceId), Event = tostring(Entry.event)
| project TimeGenerated, PodName, ContainerName, Event, TraceId, LogMessage
| order by TimeGenerated desc
Table and column availability depends on the Container Insights schema and collection settings. Older workspaces can still use ContainerLog; adapt the query after checking the tables in your workspace.
Traces: OTLP through a collector
Replace the lab’s zipkin exporter with an OTLP endpoint:
spec:
  tracing:
    samplingRate: "0.01"
    otel:
      endpointAddress: otel-collector.observability.svc.cluster.local:4317
      isSecure: false
      protocol: grpc
      timeout: 30s
The collector can add Kubernetes metadata, apply sampling and filtering, and export to Application Insights or another backend. Secure the collector endpoint, use workload identity or another supported authentication method for its Azure exporter, and test that trace IDs remain searchable in both application logs and the trace backend.
A repeatable diagnosis order
When a Dapr-enabled request fails, work from broad health to narrow evidence:
- Confirm the pod and both containers. Check readiness, restarts, events, and whether
daprdwas injected. - Reproduce one request and keep its trace ID. Avoid starting with a large time window.
- Open the trace. Find the slow, missing, or failed hop.
- Read the application log for that trace ID. Establish the business outcome.
- Read the relevant sidecar log. Look for invocation, component, resiliency, authentication, or placement errors.
- Check metrics around the same time. Decide whether the failure is isolated, app-wide, or cluster-wide.
- Inspect the control plane only when the scope justifies it. If several apps cannot resolve components or actors, examine the operator, injector, placement, scheduler, and sentry logs.
This order prevents an ordinary application error from becoming an indiscriminate control-plane investigation.
Cleanup
Stop the port-forward processes with Ctrl+C, then remove the complete lab:
kubectl delete namespace dapr-observability
Do not disable Azure Monitor metrics or delete a shared workspace merely to clean up this sample. Those resources often serve other workloads.
Takeaway
Dapr does not remove the need for observability; it creates a consistent place to obtain it. Trace one request through the sidecars, use metrics to understand the size of the problem, and correlate structured application and runtime logs by trace ID. On AKS, send those signals to managed backends with explicit collection, sampling, retention, and access policies.
The next part turns from diagnosis to production design: security boundaries, sidecar resource management, and scaling Dapr-enabled workloads on AKS.